Portfolio Details
This is an example of Excel Project
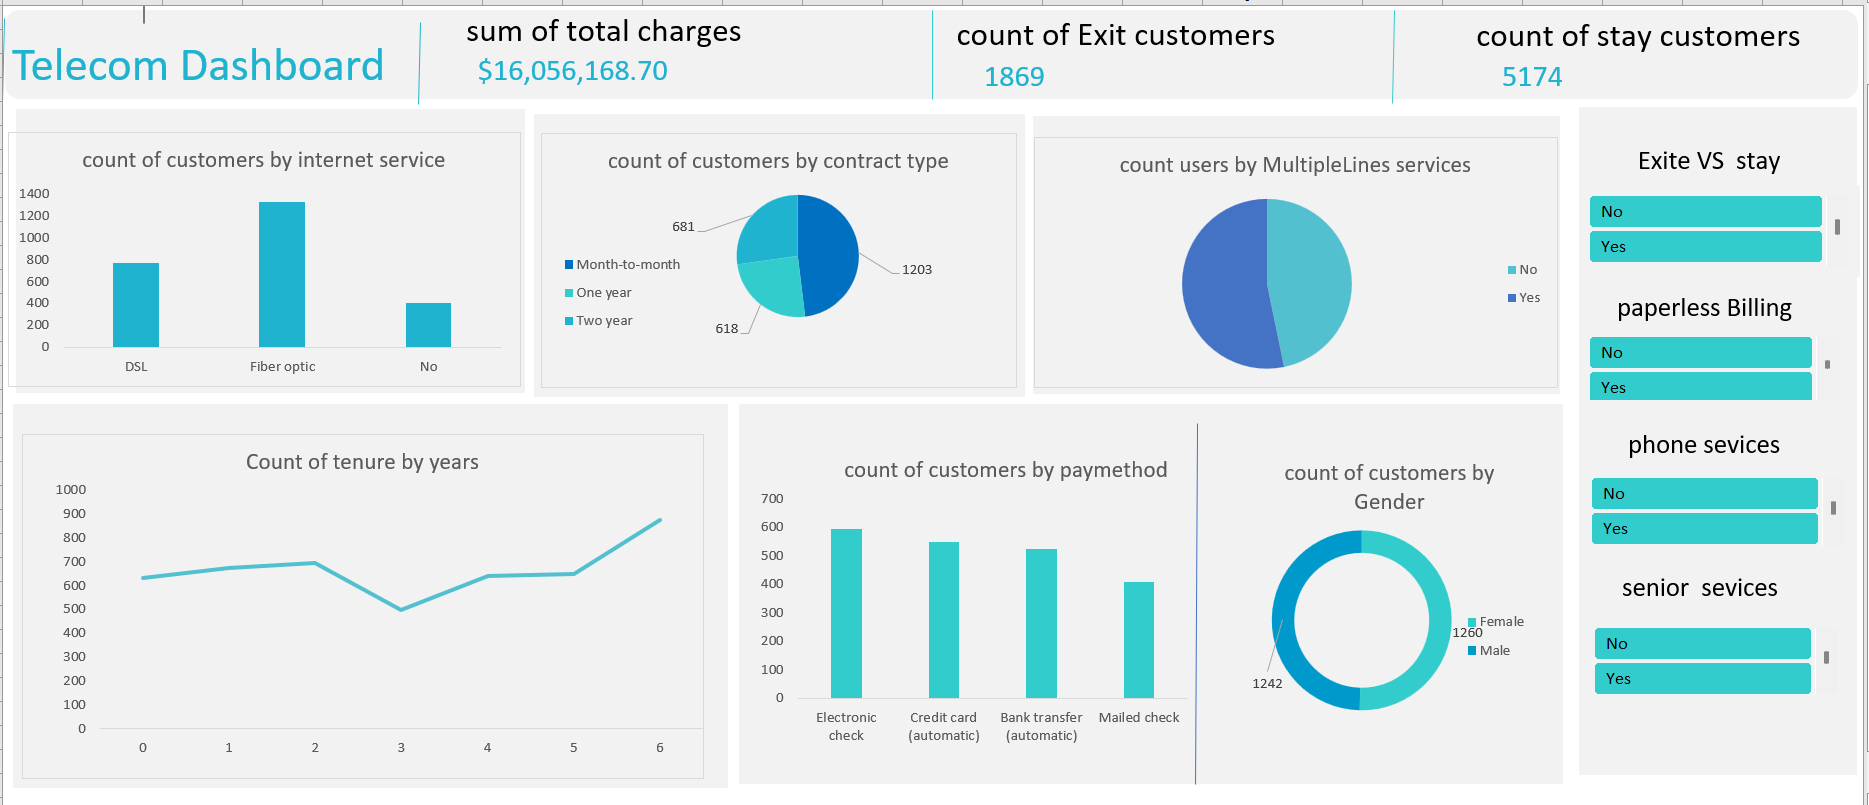
I recently worked on a Telecom Customer dataset to derive meaningful insights and enable data-driven decision-making. using Excel,I visualized critical customer metrics to explore retention and churn patterns in the telecom industry.
Key Highlights:: 📊 Churn vs. Retention Analysis: Showcased the split between exiting and staying customers with clear, actionable insights. 💡 Key Metrics Analyzed:
Customers by Internet Service (DSL, Fiber Optic, None). Payment Methods and Contract Types (Month-to-Month, One-Year, Two-Year). Tenure Analysis to understand customer lifecycle stages. Gender, Phone Service, and Senior Citizen breakdowns for demographic insights.
💰 Business Impact: This dashboard highlights trends like the prevalence of fiber optic users and correlations between month-to-month contracts and churn, helping stakeholders strategize on retention efforts.
Tools & Skills: ✅ Data Transformation & DAX Calculations ✅ Interactive Visualizations in Power BI ✅ Strong focus on actionable insights
📈 This project demonstrated the power of visual storytelling in addressing complex business problems! I'm thrilled to see how dashboards like this can guide strategies in customer retention and revenue growth.
Project information
- Category Data analytics
- tool Excel
- Project date 28 November, 2023
- View Project Engagement